The market got Wednesday’s action going on a bullish foot, though most of the intraday gain had been given back before all was said and done. The S&P 500’s close of 2651.07 was still 0.54% better than the previous day’s, but was also the low for the day.
Wednesday would have ended a bit higher had it not been for Under Armour (NYSE:UAA, NYSE:UA). The athletic apparel company saw its shares plunge roughly 10% after sharing a 2019 outlook that was less than thrilling. Nokia (NYSE:NOK) was at the other end of the spectrum, up 3.4% mostly swept up with a marketwide bounce, but at least partially fueled by the unveiling the world’s first liquid cooled base station.
The day’s most interesting story by far, however, was the launch of Tencent Music Entertainment (NYSE:TME). Shares ended the day 7.7% above its IPO price of $13 per share, as investors decided they liked the spinoff’s potential.
Still, the market’s strong start didn’t last all the way through to the end of Wednesday’s action, leaving some stock charts still dangerously close to a cliff’s edge. Indeed, HP (NYSE:HPQ), Visa (NYSE:V) and Sealed Air (NYSE:
SEE) all look like better bearish bets than bullish ones headed into Thursday’s session.
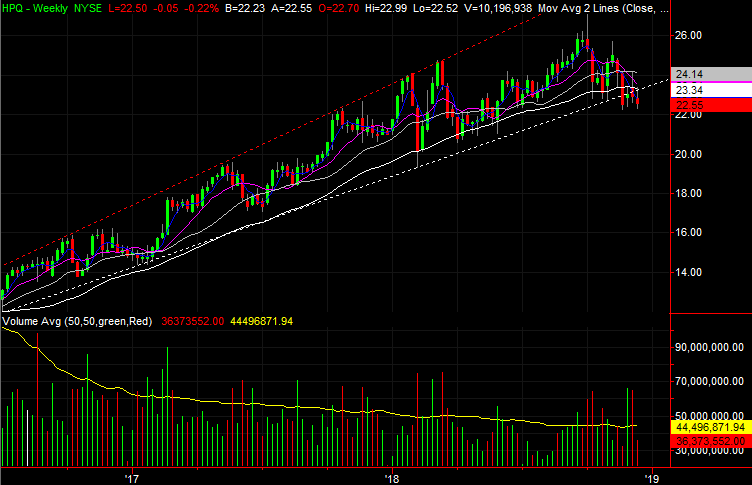
HP (HPQ)

A week and a half ago we pointed out HP shares had just broken below a couple of important support levels. Though the bulls were trying to stage a recovery rally, the odds were against HPQ stock recovering.
The stock defied that downtrend the very next day. But, it was short-lived defiance. Since then the sellers have sunk their teeth in again, and dragged HP stock all the way back to its final line in the sand.
Click to Enlarge
• The rebound effort was killed right where it was most likely to be snapped. That’s the resistance made by the gray 100-day moving average line and the purple 50-day moving average line. That stall is highlighted on the daily chart.
• If the recent lows around $22.26 are broken as support, there’s not much left that will hold the sellers back.
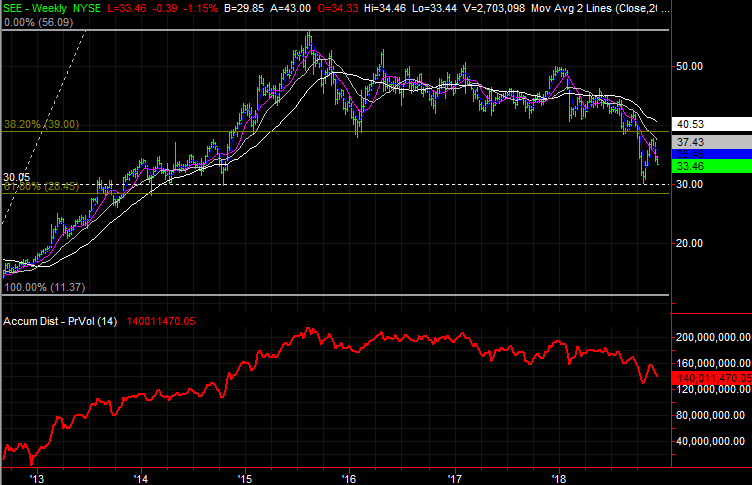
Sealed Air (SEE)
It’s an often overlooked reality of trading, but different stocks exhibit different characteristics. Some tickers make prolonged moves regardless of the market’s tide, while others are nothing but reversal prone.
Sealed Air is somewhere in between. It’s trends, both up and down, may only last a few days at a time, but while that trend is in motion, it’s serious, unfettered movement. That makes the stock’s current downtrend a very compelling one.
Click to Enlarge
• In a bigger-picture sense, the volume has been net-bearish the whole time. Even when the bulls were pushing back in October, the buying volume was fading on the way up. The selling volume is growing now.
• Keep a close eye on the support area around $30.05. Not only was that October’s low, it was a point of contention before the 2015 rally.
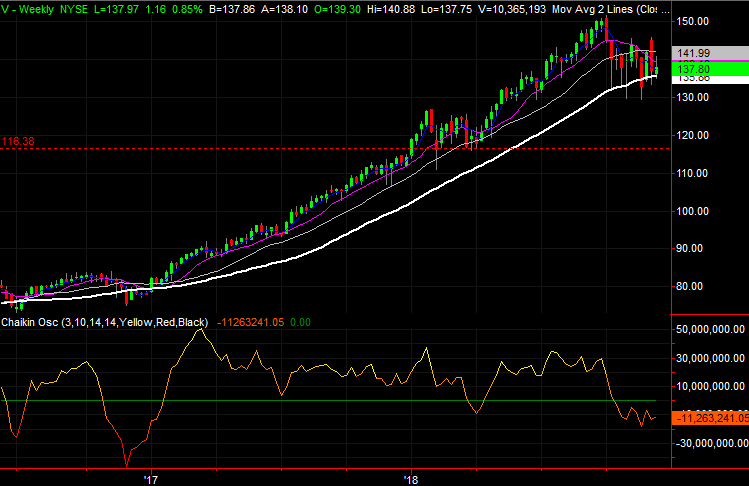
Visa (V)
Finally, back in late November Visa had slipped back into bearish mode, falling back below its 200-day moving average line for a second time in about a month. This time, though, a recovery looked unlikely. V did bounce back though, even crossing back above all of its key moving average lines.
It didn’t last. Visa is once again taking aim at a crucial support level, this time in more of a bearish condition than it was just a few days ago. The bulls aren’t apt to take a risk a third straight time V dips.
Click to Enlarge
• In the meantime — just within the past few days — the purple 50-day moving average line has become a technical ceiling that’s pushing V stock back toward the white 200-day moving average line.
• Zooming out to the weekly chart of Visa readily illustrates just how vulnerable shares are to profit-taking, and how hard the rally has already hit a wall.
As of this writing, James Brumley did not hold a position in any of the aforementioned securities. You can follow him on Twitter, at @jbrumley.